GCSE Examination results
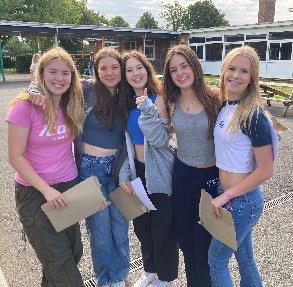
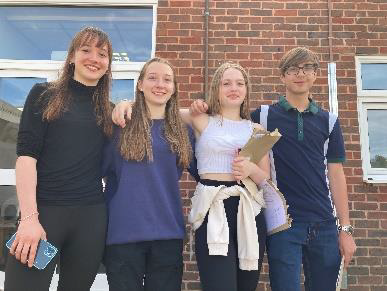
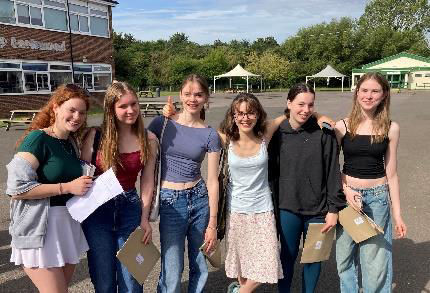
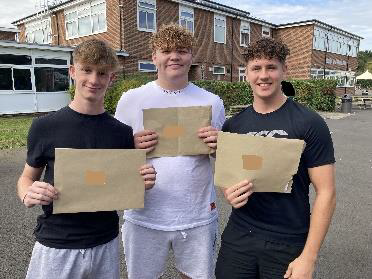
GCSE Examination Results
Last year, the government made the decision that many exams and assessments could not be held fairly in 2021 as a result of the disruption students faced due to the pandemic. Teachers instead submitted GCSE grades to the exam boards, based on their assessment of what the students showed they knew and could do, enabling them to progress to the next stage of their education, training or employment.
Results below are given for the whole cohort of students who were in Year 11 and awarded final GCSE results in Summer 2021. Due to the nature of these results, further analysis is not expected on the government’s school comparison website, which is linked here.
All but one of the key performance indicators that school leaders, parents and Ofsted can use to compare the outcomes of different schools can be calculated for this set of results. Although these have been given alongside last year’s results, it is recognised that the process of awarding these grades is not comparable to any previous years and, similarly, few national figures are available for comparison. The key measures are:
9-4 E&M |
The percentage of students gaining a standard pass (grades 9-4) both in English and in Maths |
9-5 E&M |
The percentage of students gaining a strong pass (grades 9-5) both in English and in Maths |
Attainment 8 |
The average grade (points) achieved by a student across their 8 best subjects |
Progress 8 |
The average progress made by students in the school compared to national figures. This measure is not available in 2021 |
EBacc APS |
A relatively new measure, giving the average points score per student across the five pillars of the English Baccalaureate |
Attainment
Attainment figures for the recent GCSE results and those for last year are given below. A 9-4 grade is roughly comparable to gaining A*-C in the legacy GCSEs and is termed a standard pass under the new system.
|
2019 |
2020 |
2021 |
2019 National |
9-4 E&M |
62% |
76% |
72% |
64% |
9-4 English |
73% |
87% |
82% |
76% |
9-4 Maths |
67% |
80% |
75% |
70% |
Attainment 8 |
41.9 |
47.1 |
45.9 |
46.6 |
In addition, alongside the introduction of the new 9-1 grades for GCSE, grades 9-5 are now being referred to as a strong pass. 9-5 figures for the recent GCSE results are given below.
|
2019 |
2020 |
2021 |
2019 National |
9-5 E&M |
33% |
52% |
39% |
43% |
The decision by the government to base grades on the school’s teacher assessed grades was welcomed by all staff. We are very pleased that the final grades awarded to last year’s Year 11 students reflect what each student deserved, evidenced by assessments and NEAs, as well as classwork and homework produced on the course.
These grades recognise the hard work, determination and engagement of our students and staff alike. Our focus on high quality teaching and learning and the culture of challenge, celebration and support for each student in our community meant that students were well prepared to achieve results in their internal assessments that truly reflected their ability and effort.
Progress
Student Progress is assessed and reported through the Progress 8 measure that compares every student’s results with those of students nationally with similar KS2 attainment. Due to the way in which grades were awarded in 2021, this has not been calculated by the DfE and cannot be reported here.
It is also not possible to compare student progress in 2021 with students from the last time examinations were sat (in 2019) as the 2021 cohort of students were the first ones to sit the new KS2 assessment tests.
Further Analysis
We are proud of each and every one of our students for what they have achieved in their first five years at Larkmead. Progress at all levels shows the value that a Larkmead education adds to our students.
Eighteen students gained six or more GCSEs at grades 9-7. These students are listed below.
Virginia Bentley |
Lara Hogan |
Barnaby Merriman |
Stefan Trnjakov |
Nellie Grindey |
Isabel Sadler |
Sumpa Abbey |
Elliott Brown |
Annie Buckingham |
Leo Hopgood |
Niamh Cowan |
Bella de Oliveira |
Edward Frank |
Caitlin Watts |
Amber Courtney |
Robert Glasby |
Yasmin Hunter |
Elise Macey |
A breakdown of grades for each subject is given below:
Entries |
9 |
8 |
7 |
6 |
5 |
4 |
3 |
2 |
1 |
Other |
9-7 |
9-4 |
|
English |
141 |
4 |
5 |
16 |
20 |
27 |
39 |
20 |
6 |
2 |
2 |
18% |
79% |
English Literature |
140 |
4 |
5 |
13 |
20 |
32 |
26 |
33 |
5 |
0 |
2 |
16% |
71% |
Mathematics |
141 |
3 |
10 |
11 |
11 |
36 |
35 |
24 |
6 |
3 |
2 |
17% |
75% |
|
|
||||||||||||
Art |
20 |
0 |
0 |
4 |
3 |
7 |
2 |
3 |
0 |
1 |
0 |
20% |
80% |
Astronomy |
4 |
0 |
0 |
0 |
1 |
2 |
0 |
0 |
1 |
0 |
0 |
0% |
75% |
Biology |
26 |
1 |
5 |
5 |
5 |
2 |
3 |
5 |
0 |
0 |
0 |
42% |
81% |
Business |
26 |
0 |
2 |
3 |
3 |
4 |
3 |
4 |
5 |
0 |
2 |
19% |
58% |
Chemistry |
26 |
1 |
3 |
8 |
6 |
0 |
4 |
3 |
1 |
0 |
0 |
46% |
85% |
Computer Science |
2 |
1 |
0 |
1 |
0 |
0 |
0 |
0 |
0 |
0 |
0 |
100% |
100% |
D&T: Elecs and Mechs |
13 |
0 |
0 |
2 |
2 |
2 |
2 |
3 |
2 |
0 |
0 |
15% |
62% |
D&T: Graphics |
16 |
0 |
0 |
1 |
1 |
2 |
5 |
1 |
4 |
1 |
1 |
6% |
56% |
D&T: Resistant Materials |
17 |
0 |
0 |
2 |
6 |
2 |
2 |
2 |
1 |
2 |
0 |
12% |
71% |
Dance |
16 |
0 |
0 |
1 |
3 |
6 |
1 |
2 |
3 |
0 |
0 |
6% |
69% |
Drama |
19 |
0 |
1 |
2 |
2 |
3 |
6 |
3 |
1 |
0 |
1 |
16% |
74% |
Film Studies |
42 |
0 |
1 |
2 |
6 |
8 |
11 |
6 |
5 |
3 |
0 |
7% |
67% |
Food and Nutrition |
39 |
1 |
0 |
5 |
4 |
10 |
6 |
5 |
4 |
2 |
2 |
15% |
67% |
French |
11 |
0 |
4 |
1 |
1 |
2 |
2 |
1 |
0 |
0 |
0 |
45% |
91% |
Further Mathematics |
3 |
0 |
1 |
2 |
0 |
0 |
0 |
0 |
0 |
0 |
0 |
100% |
100% |
Geography |
24 |
0 |
1 |
3 |
1 |
3 |
5 |
7 |
4 |
0 |
0 |
17% |
54% |
History |
83 |
3 |
5 |
4 |
14 |
16 |
14 |
7 |
12 |
6 |
2 |
14% |
67% |
Music |
22 |
2 |
5 |
2 |
1 |
2 |
3 |
4 |
3 |
0 |
0 |
41% |
68% |
Photography |
14 |
0 |
0 |
2 |
3 |
1 |
5 |
1 |
2 |
0 |
0 |
14% |
79% |
Physics |
26 |
2 |
5 |
7 |
4 |
0 |
1 |
6 |
1 |
0 |
0 |
54% |
73% |
Religious Studies |
25 |
1 |
2 |
3 |
4 |
3 |
7 |
3 |
0 |
2 |
0 |
24% |
80% |
Science 1 |
115 |
7 |
3 |
6 |
3 |
18 |
48 |
17 |
10 |
1 |
2 |
14% |
74% |
Science 2 |
115 |
5 |
3 |
2 |
8 |
11 |
41 |
24 |
14 |
5 |
2 |
9% |
61% |
Sociology |
28 |
1 |
2 |
0 |
5 |
4 |
4 |
6 |
3 |
0 |
3 |
11% |
57% |
Spanish |
26 |
2 |
0 |
3 |
1 |
3 |
9 |
3 |
2 |
1 |
2 |
19% |
69% |
Sports Studies |
29 |
1 |
1 |
1 |
4 |
6 |
6 |
7 |
3 |
0 |
0 |
10% |
66% |
Statistics |
47 |
0 |
0 |
0 |
0 |
6 |
16 |
15 |
7 |
3 |
0 |
0% |
47% |
Entries |
Level 2 |
Level 1 |
Other |
D*-D (Level 2) |
D*-P (Level 2) |
||||||
|
D* |
D |
M |
P |
D |
M |
P |
||||
Creative iMedia |
23 |
0 |
0 |
5 |
4 |
4 |
3 |
4 |
3 |
0% |
39% |
The English Baccalaureate Average Points Score
The English Baccalaureate (EBacc) is a school performance indicator (as opposed to a qualification in its own right) and measures the percentage of students who achieve a strong pass (grades 9-5 or A*-C) in “traditionally academic” GCSE subjects. To qualify for inclusion in this English Baccalaureate figure, students must choose to study English, Mathematics, two Sciences, a foreign language and History or Geography, all at GCSE level.
The EBacc APS calculates a pupil's average point scores across the 5 pillars of the English Baccalaureate, allocating points to a pupil's best grades and dividing by 6 (the science grades count in 2 pillars) to create an average point score per pupil. All students are included in the EBacc APS measure but those who have not studied a subject within any one pillar score zero within that pillar. This means that this figure is considerably lower than the average GCSE result within the school.
|
2019 |
2020 |
2021 |
2019 National |
EBacc APS |
3.59 |
4.12 |
3.84 |
4.07 |
A great deal of work has been done to ensure that students at Larkmead School that wish to pursue careers in which employers will look for the EBacc range of subjects make the appropriate choices in Year 8 to ensure that they are successful in their Year 9 to 11 studies. This continues to be developed as the government and employers are being more specific in the range of subjects in which all students should be qualified. However, there is no expectation that all pupils study an EBacc range of subject and Larkmead School is committed to allowing its students to choose the pathway that is best suited to their individual skills, enthusiasms and ambitions.
Destinations
The percentage of students who continue in education or training, or move on to employment in the year after the end of Key Stage 4 at Larkmead School is 97.3%.
We are incredibly proud of the achievement of all of our students at Larkmead School, both due to these results and for the way they have coped with the difficulties during 2020-21 and the pandemic.
We wish all our outgoing Year 11 students the best of luck in their future education and work. We are also delighted to welcome a large number back into Larkmead’s thriving sixth form to further their studies in their chosen areas of specialism.